
Podcast Advertising Benchmarks for 2026

Your CFO wants to know what a podcast test will deliver, and the slide in front of you has one number: CPM. Or the campaign has already run, and the team is arguing over whether the result was good because nobody agreed on what “good” meant before launch.
Useful podcast advertising benchmarks don't boil performance down to one industry average. They connect each target to a campaign's job, then make sure the price and delivery units are comparable. U.S. podcast ad revenue reached $2.43 billion in 2024, growing 26.4% year over year, according to the Interactive Advertising Bureau and PwC. The channel is large enough that a blended average can hide important differences between an awareness buy and a direct-response flight.
A defensible plan separates aided recall, site visits, leads, purchases, and assisted actions such as branded search or word of mouth. It also checks what counts as an impression, which format is doing the work, and whether the forecast can be rebuilt from spend, reach, and frequency. Before you use any benchmark, get clear on the units being counted.
Table of Contents
Why Podcast Benchmarks Changed for 2026 - Make the campaign's job the benchmark
What a Podcast CPM Actually Counts - Normalize before comparing publishers
Benchmarks by Funnel Objective - Read response and assisted action in context
How Format Length and Vertical Shift Results - Match the vertical to the outcome
Why Podcast Benchmarks Changed for 2026
In a planning meeting, the demand-gen lead may be asked to approve a podcast test with a target CPM but no agreed conversion goal. After the flight, finance sees few last-click purchases and asks why the team paid for impressions instead of clicks. Both conversations start from the same mistake: treating one buying metric as the answer to every campaign question.
A CPM can tell you what a thousand counted ad impressions cost. It can't tell you whether those impressions reached enough of the right people, whether listeners remembered the brand, or whether the campaign helped generate later searches and sales. Those are different outcomes, and each needs its own measure.
Make the campaign's job the benchmark
Start with the result you need to defend. A consumer brand might need evidence of awareness and brand fit. A B2B team might care more about qualified site visits, demo requests, or assisted pipeline. A performance campaign may prioritize site visits and purchases, but those numbers still need to be read as separate stages rather than one blended conversion rate.
Then make the comparison fair. A cheap price per impression may not be a cheap way to reach a unique listener. A host-read placement and a dynamically inserted spot can also have different delivery and exposure mechanics, so a single blended CPM can hide what each one contributes.
The useful approach is a small set of benchmarks tied to campaign objectives. Keep awareness, site visits, leads, purchases, and assisted actions separate in the plan and report. When a campaign comes back with modest last-click ROAS, you'll have the measures needed to judge whether that was a failure of the buy, a mismatch between objective and metric, or an attribution gap.
What a Podcast CPM Actually Counts
A CPM is a price tag on counted ad impressions, not on people. That distinction matters because an impression, a download, a reached listener, and frequency describe different things. Under the IAB Australia Audio Buyers Guide, a legitimate download generally requires at least 60 seconds of content, a unique IP-address and user-agent combination within a 24-hour period, and the exclusion of bots and spiders.
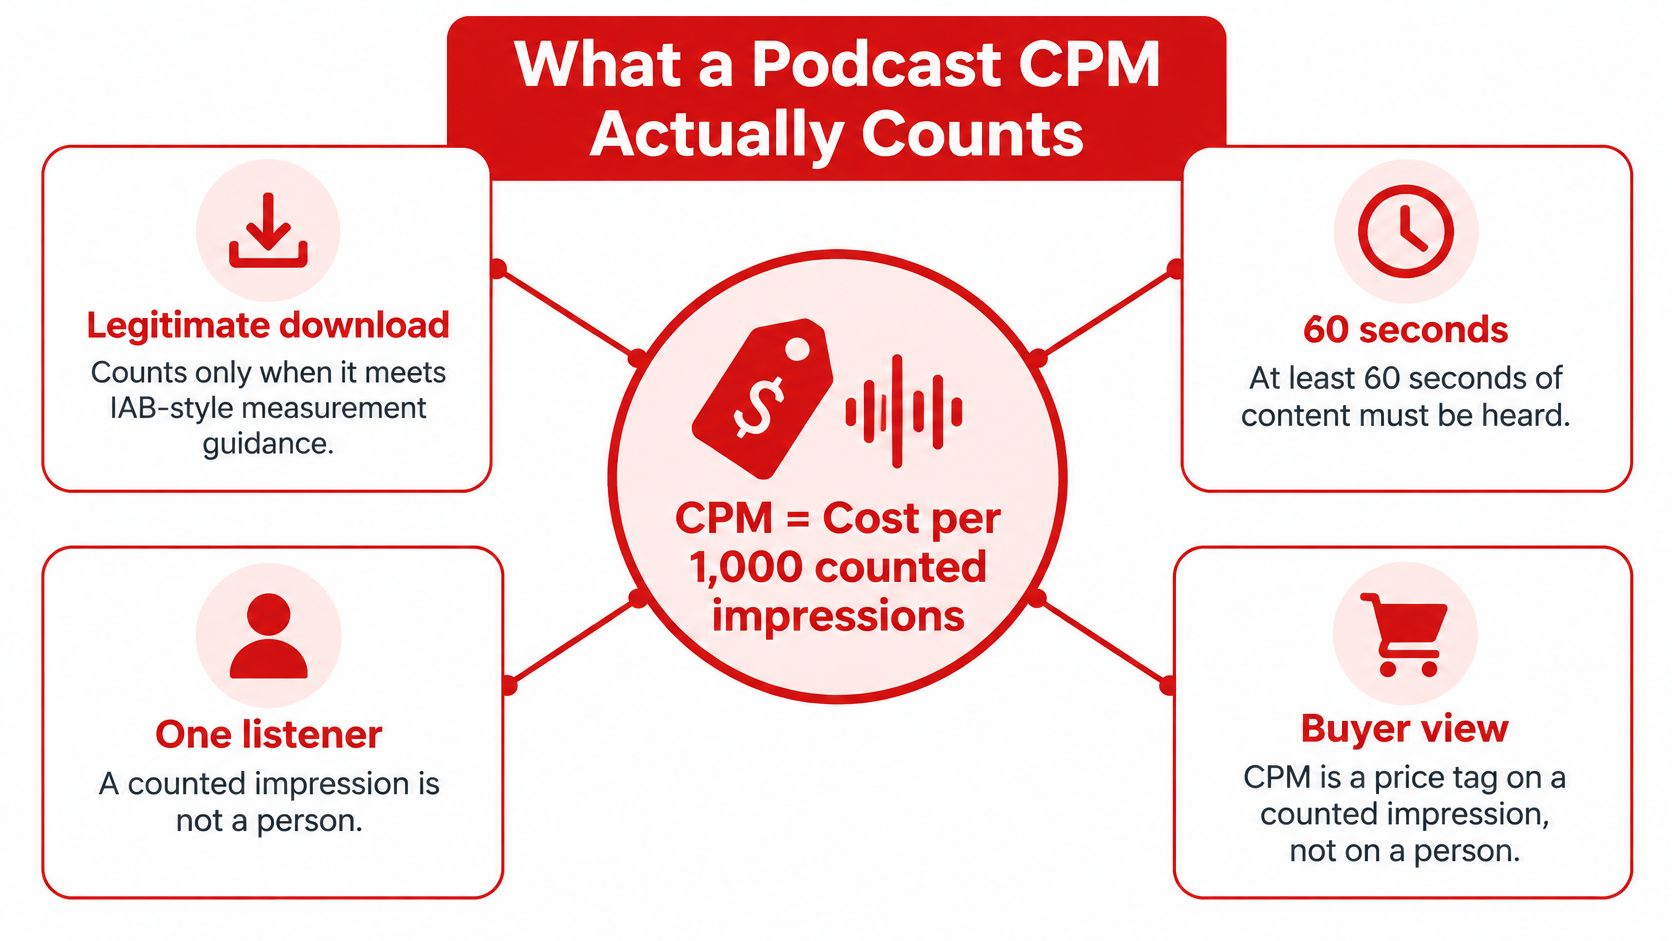
For buying and reporting, an impression is an ad counted in a pre-roll, mid-roll, or post-roll position. If one listener hears the same ad in all three slots, that can count as three impressions. The CPM still counts those impressions, even though the campaign reached one person. Efficiency from stacked slots isn't efficiency if the extra impressions mostly raise frequency.
Normalize before comparing publishers
Ask each publisher what the price is based on, how delivery is certified, and how it estimates unique reach. The report should include impressions, estimated unique reach, average frequency, and completion or listen-through data when available. Frequency is impressions divided by reached individuals.
Say a campaign delivers 100,000 impressions at a $20 CPM. The media cost is $2,000. At a frequency of four, estimated unique reach is about 25,000 people, making the cost per reached listener $0.08. That's a more useful comparison point than CPM alone when you're judging whether the buy can generate site visits.
A publisher selling against downloads and a network selling against impressions aren't directly comparable until you restate both offers in terms of counted ads and estimated people reached. For dynamic placements, ask how insertion and delivery are handled. The practical details of dynamic ad insertion can affect how impressions accumulate across shows and episodes.
Buyer rule: Normalize the unit first. Format rows only mean something after you know what each price counts.
Benchmarks by Funnel Objective
A demand-gen campaign can show modest last-click ROAS while still supporting recall, site visits, and assisted actions. Set the benchmark by the job the campaign needs to do, then judge each metric against that objective. Nielsen's 2025 norms, based on nearly 2,000 podcast brand-impact case studies, report average lifts of 10 points in awareness, 8 points in information-seeking, and 6 points in purchase intent in its podcast brand-impact findings.
Objective | Primary metric | Published benchmark | Planning target |
|---|---|---|---|
Brand awareness | Recall and awareness lift | Nielsen reports a 10-point average lift in awareness. In a separate 2025 read, 70% of ad-exposed listeners recalled the brand. | Aim for recall near 70% when listeners also see the brand as a fit for the show. |
Information seeking | Site visits and information-seeking lift | Nielsen reports an 8-point average lift in information-seeking. | Track qualified site visits and branded search separately. |
Lead response | Visitor-to-lead rate | Use the visitor-to-lead rate from the campaign's own tagged site traffic. | Set a target against your historical visitor-to-lead performance before changing shows. |
Purchase | Purchases and purchase intent | Nielsen reports a 6-point average lift in purchase intent. | Judge tracked purchases separately from self-reported immediate buying. |
Assisted action | Talk, search, and social activity | Listeners may discuss an advertised product, search for more information, or visit the brand's social profiles after hearing an ad. | Count these actions even when no click is tagged. |
For awareness, Nielsen's separate 2025 read found 70% of podcast ad-exposed listeners recalled the advertised brand, while 66% considered it a good fit for the show's content, according to Nielsen's reported brand-metric findings. Read recall alongside brand fit: strong recall with weak fit can point to a mismatch between the placement and the creative.
Read response and assisted action in context
Listeners may hear an ad, search for the brand later, or mention it in conversation. These actions can contribute to demand even when a last-click report assigns no purchase to the podcast.
For direct response, measure each step separately: exposure to site visit, visit to lead, and visit to purchase. Compare the campaign's cost per reached listener with the result for its chosen objective. A modest last-click ROAS does not settle the awareness question; report brand effects and direct response as distinct outcomes.
How Format Length and Vertical Shift Results
When a campaign has to defend its budget, choose the ad format by funnel job, then compare cost per reached listener. A low CPM can still be a poor buy if repeat slots inflate delivery or the audience fit is weak.
Format | Typical length | Judge it on | Main trap |
|---|---|---|---|
Host-read mid-roll | About 60 seconds | Recall, fit, and response quality | Comparing a download-priced offer directly with an impression CPM |
Pre-roll | 15–30 seconds | Reach at a controlled frequency | Expecting a short spot to do the work of a host-read story |
Post-roll | 15–30 seconds | Completion, not raw CPM | Buying on price when listeners may have already left |
Baked-in sponsorship | Full host read, lives with the episode | Brand association over the long tail | Limited ability to pause or cap frequency quickly |
Programmatic or dynamic insert | 15–60 seconds | Cost per reached listener after bot filtering | A cheap CPM inflated by repeat slots |
Video podcast | Audio plus picture | Separate video completion and recall | Blending video delivery into an audio CPM average |
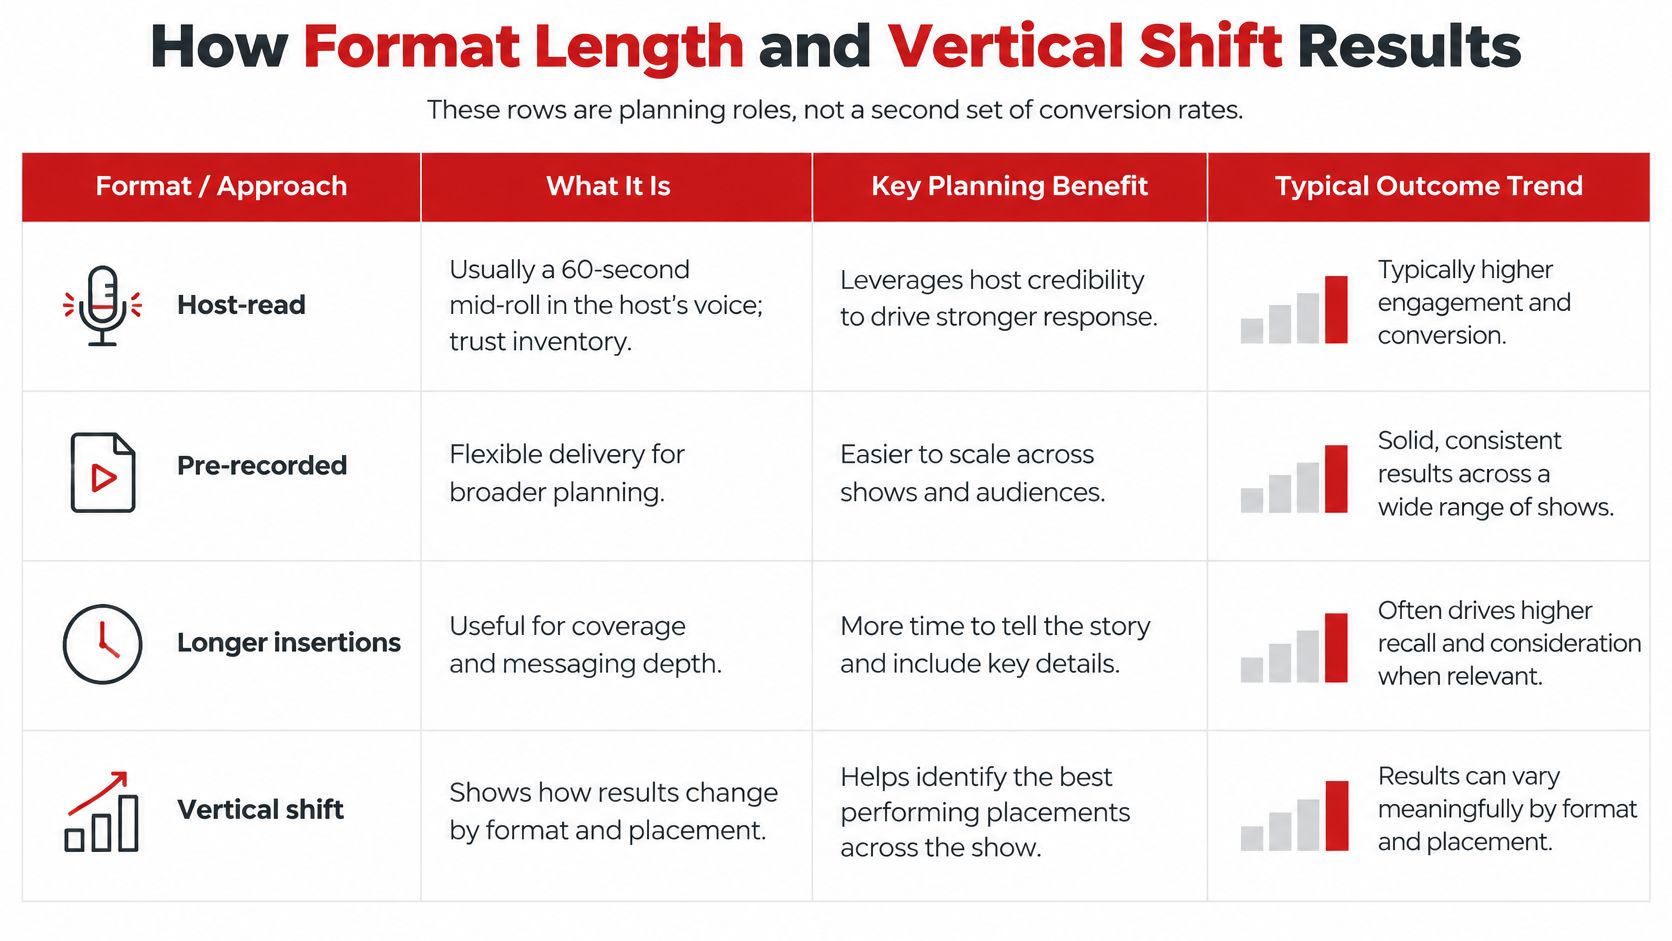
A host-read mid-roll gives the message room to connect with the show and its host. A short pre-roll has less room for a story, so keep it to one offer and one clear URL. For post-roll, consider whether listeners stay through the end. A lower quoted CPM is no bargain if few listeners hear the ad.
Baked-in sponsorship remains with the episode, while dynamic insertion can be changed or paused as inventory allows. Choose the durable placement when long-term association matters; choose dynamic inventory when pacing and campaign changes matter more. Programmatic placements can extend scale across shows, but judge the buy on audience fit and cost per reached listener, not CPM alone.
Match the vertical to the outcome
For consumer packaged goods or wellness, use the purchase-intent objective when the campaign is designed to influence a considered purchase. B2B SaaS teams should prioritize qualified visits, demo requests, and pipeline, since an immediate-purchase measure may not capture a longer sales journey. Vertical-specific CPM and completion rates vary by show and market, so set targets from the objective row you selected rather than applying a generic rate.
If you're testing landing-page messaging against an audio offer, choosing an AI landing page tool can help you compare ways to build a focused destination for campaign traffic. Keep the page's promise aligned with the ad. A strong placement cannot make a confusing next step clear.
How to Forecast Spend Reach and Cost
Use a forecast you can rebuild line by line. The Magellan AI benchmark reported by Sounds Profitable found that 2.29% of unique exposed podcast listeners visited an advertiser's website within 30 days. Among those visitors, 9.74% became leads and 5.22% completed a purchase. The worked example below applies those rates as nested-funnel math, not as a guarantee.
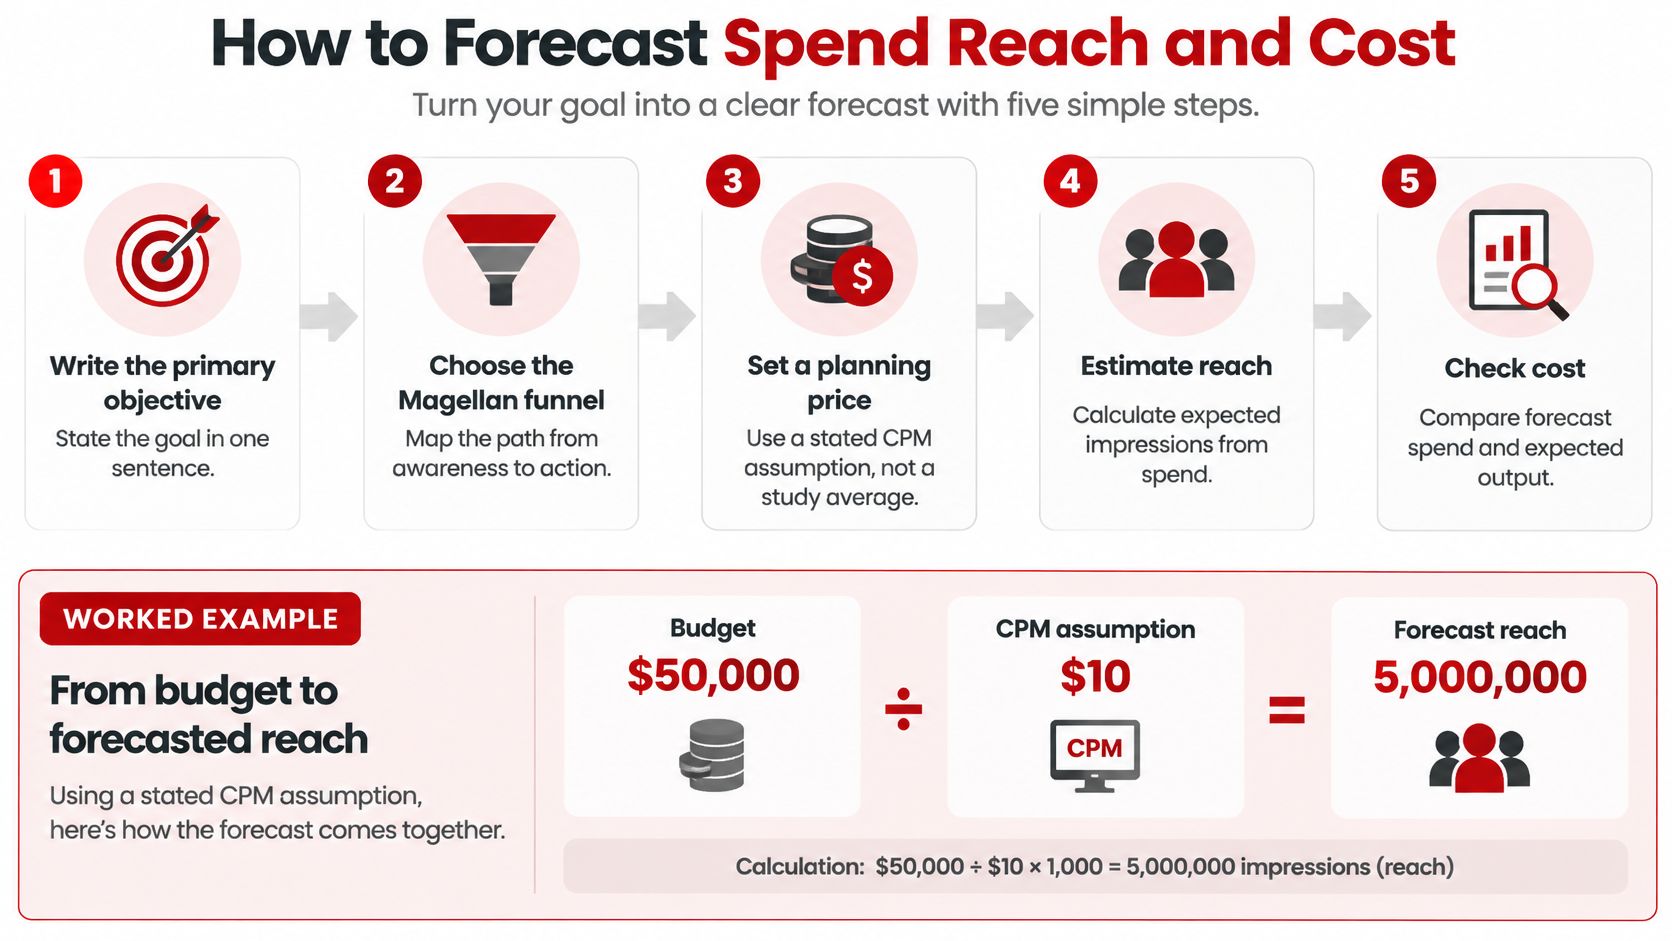
Write the objective. Suppose the primary goal is site visits. Use the exposed-listener-to-visit rate as the measure, with a defined 30-day window.
Set the budget and planning price. Assume a $50,000 budget and a $25 planning CPM. That CPM is a scenario assumption, not a published study average.
Calculate impressions. At $25 per thousand impressions, $50,000 buys 2,000,000 impressions.
Estimate reach. Set an average frequency cap of three. Divide 2,000,000 impressions by three to estimate about 667,000 reached listeners. Treat that as an estimate until the publisher deduplicates delivery.
Forecast visits. Apply 2.29% to estimated unique reach, not to impressions. That gives approximately 15,300 site visits within 30 days.
Apply the downstream rates. Applying 9.74% to visitors gives about 1,490 leads. Applying 5.22% to visitors gives about 800 purchases. Both are nested-funnel estimates based on the published rates.
Work out unit costs. Divide $50,000 by the estimated leads for a cost per lead near $34. Divide it by estimated purchases for a cost per purchase near $63.
Stress-test frequency. If the actual frequency is six because three slots fire repeatedly, estimated reach halves. With the same impressions and spend, the forecasted audience-based outcomes fall too, and costs per outcome roughly double even though the CPM hasn't changed. For a B2B demo goal, stop the forecast at qualified visits and pipeline rather than forcing the purchase row.
Report impressions, unique reach, frequency, completion, site visits, and the downstream rate, each with its lookback window. Keep the underlying assumptions visible so finance can change the CPM, frequency, or conversion rates and see how the forecast moves.
One Campaign Read Two Ways
Consider an illustrative wellness campaign with a $50,000 flight, weighted toward host-read mid-rolls in health shows and supported by a smaller programmatic layer. Pixel reporting shows purchases near 0.12% of exposed unique listeners, the approximate nested-funnel purchase rate calculated from the published visitor and purchase rates. Finance sees modest last-click ROAS and asks to cut the channel.
The brand lead sees a different picture: recall is close to the reported benchmark, listeners say the brand fits the show, and branded searches and product conversations show activity beyond tracked site visits. Those indicators don't prove the campaign drove every later sale, but they show why last-click purchases alone can understate a campaign designed to build awareness and interest.
There's another useful distinction. In 2025, 22% of frequent podcast users reported making an immediate purchase after hearing a podcast ad, according to a Sounds Profitable study conducted with Signal Hill Insights. That's a self-reported finding among frequent listeners, not a pixel conversion rate for this flight. It helps explain why some buyers may act without following a tagged site path, but it shouldn't be used as the campaign's measured purchase rate.
A lower CPM isn't a reason to move budget if the cheaper placement can't do the job the campaign needs.
The sensible decision is to keep host-reads responsible for the awareness and fit objective, cap frequency on the programmatic layer, and judge the direct-response slice on its own visit and purchase measures. A B2B SaaS team running a similar buy should track demo requests and sales-accepted pipeline over an appropriate window, not copy the wellness purchase target. Set up an attribution model that can distinguish direct and assisted outcomes; this guide to podcast attribution models can help frame that decision.

Before the post-campaign meeting, write down the objective row that will determine whether the flight succeeded. That turns the review from a dispute over one number into a decision about whether each placement delivered its assigned job.
Lock Your Targets Before You Buy
Set these five conditions before you sign an insertion order:
Name the primary objective. Copy its benchmark row into the plan and write down the acceptable target for that campaign.
Define the buying unit. State whether the price is based on downloads or counted impressions, then convert it to estimated cost per reached listener before comparing shows.
Set frequency in advance. Put a cap in the plan so repeated slots don't increase reach costs unexpectedly.
Assign the format its job. Use host-read for trust and response quality when that's the priority; use programmatic to add reach after the cap is set.
Document measurement. Record the attribution window, bot filtering, and tags used to report site visits and purchases.
Refuse a plan that quotes one CPM across mixed slots or formats without explaining the counting method. For help with the buying process, use this practical guide to how to buy podcast ads. The five locks are the test the plan must pass before money moves.
Podmuse builds podcast media plans spanning host-read ads, programmatic placements, and in-app promotions, and manages strategy, execution, and optimization across ad networks, publishers, and marketplaces. Its AI-Powered Podcast Media Plan delivers relevant podcasts and YouTube channels as a full media plan within 24 hours. Visit Podmuse to discuss a campaign mix tied to your objective, reach assumptions, and budget.
Comments